Annual Report 2010
- Legal and Financial Report
- Consolidated Analytical Report
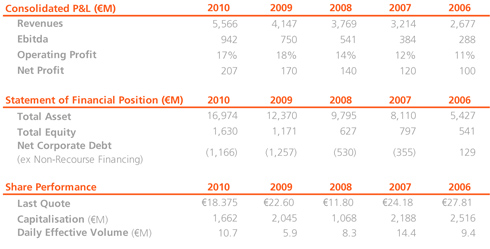
Relevant Figures
Economic Data
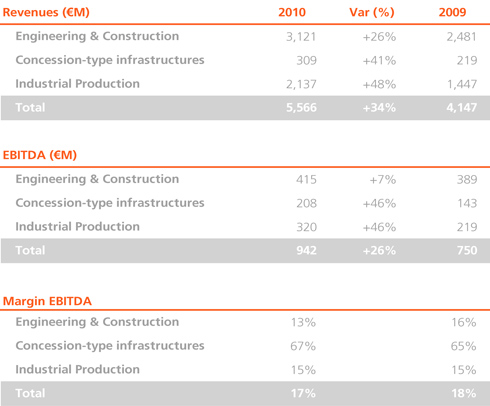
- Sales of €5,566 M, a rise of 34% compared to 2009.
- EBITDA of €942 M, an increase of 26% compared to 2009.
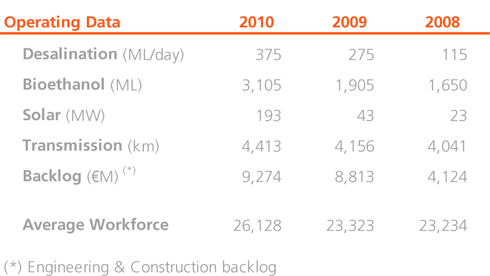
Operanting Data
- International activities account for 74% of consolidated sales.
- The engineering order book is worth €9,274 M.
- 12 new plants in operation in 2010.
Consolidated Profit & Loss Account
A summary of Abengoa’s Consolidated Income Statement for 2010, 2009 and 2008 is given below:
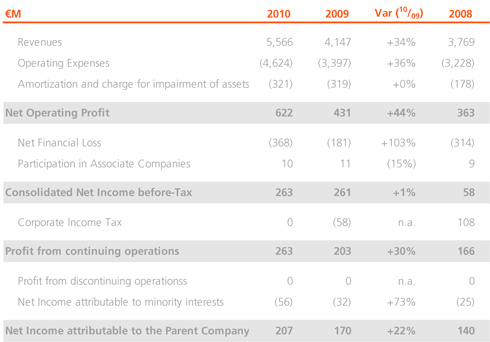
The comments on the main variations in the income statement are as follows:
- Abengoa’s consolidated sales to December 31, 2010 rose by 34% to €5,566 M compared to the same period the previous year. This increase was fundamentally due toa:
- Entry into production of new bioethanol plants in Europe (Holland) and the USA (Indiana and Illinois).
- Higher volume of treated waste
- Progress in the construction of the cogeneration plant in Tabasco (Mexico); in transmission lines in Brazil and Peru, as well as in the execution of solar plants abroad.
- Operating income rose by 44% to €622 M compared to €431 M the year before, representing a margin on sales of 11% (10% in 2009). The principal factors behind this increase were:
- Higher ethanol sales in the USA and Europe, and better sales prices across three regions (USA, Europe and Brazil).
- Higher volume of treated waste.
- Entry into production of new transmission lines in Brazil (ATE IV-VII)).Entry into production of new solar plants in Spain (Solnova 1, Solnova 3 and Solnova 4).
It should be noted that operating income includes Abengoa’s investment in R&D+i, recorded as €-67.2 M in the income statement (€-52.1 M in research and innovation expenses and €15.1 M in the depreciation of development assets) compared to €-61.5 M in 2009.
Likewise, in 2010, as a continuation of Abengoa’s asset rotation policy, the company sold two transmission lines in Brazil in which Abengoa held a minority stake resulting in a capital gain of €68.9 M (€45.6 M after tax). In 2009, the company sold 23.9% of its stake in Telvent, which generated a gain of €56.3 M (€37.7 M after tax). Excluding these two effects, operating income would have risen by 48%.
- Financial income jumped from -€181 M in 2009 to -€386 M in 2010 primarily due to the increase in financial expenses as a result of the various bond issues that Abengoa made during 2010.
- Consolidated income before tax rose by 1% to €263 M compared to €261 M the year before.
- With regards to corporate income tax in 2010, the result was affected by the investment and dedication to R&D+i activities, the contribution to Abengoa’s profit by income from other countries, as well as prevailing tax legislation.
- Income attributable to external shareholders increased by 73% from -€32 M in 2009 to -€56 M in 2010. This increase was primarily driven by the recognition of 60% of Telvent’s result being attributable to external shareholders (following the aforementioned divestment) and to the stronger result in the waste recycling area in which Abengoa does not own a 100% shareholding.
- Income attributable to the parent company in 2010 rose by 22% to €207 M compared to 2009, equivalent to earnings per share of €2.29 (a 22% increase over 2009).
For more information see the consolidated income statement and the notes to the consolidated financial statements in Volume III.
Results by Activities
-
Engineering & Construction
- Progress in the construction of the cogeneration plant in Tabasco (Mexico); in high voltage transmission lines in Brazil and Peru, as well as in the execution of solar plants in Africa.
- Advances in executing the desalination projects in Algeria, China and India.
Concession-type infrastructures
- Entry into production during 2010 of three new 50 MW solar plants in Spain (Solnova 1, 3 and 4) and of four new transmission lines in Brazil (ATE IV-VII).
- A whole year’s production of the Skikda desalination plant (Algeria) and of the 20 megawatt PS-20 solar plant in Spain.
Industrial Production
- Higher ethanol production thanks to three new plants coming into operation (two in the USA and one in Europe) that have increased capacity to more than 3,100 ML/year.
- Recovery in the volumes of recycled material after 2009 was affected by the economic crisis and its underlying effect on industrial output in Europe
Activity – Business Group reconciliation
Analysis of the Consolidated Balance Sheet
A summary of Abengoa’s consolidated balance sheet for 2010, 2009 and 2008 is given below, with the main variations:
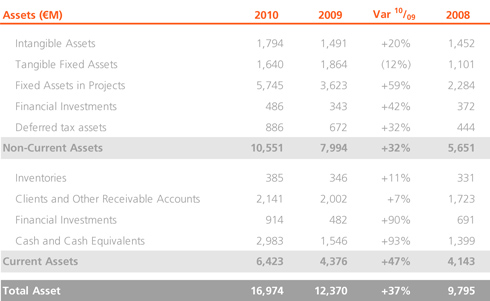
- Non-current assets increased by 32% to €10,551 M primarily due to the increase in the fixed assets of projects under construction for the solar business (solar plants in Spain and Algeria), bioenergy (plants in Rotterdam, Indiana and Illinois), electricity transmission line concessions in Brazil and Peru, and desalination plants in Algeria, India and China.
- Current assets increased by 47% to €6,423 M mainly driven by the increase in financial investments (mainly from higher bank deposits) and cash (bond issues).
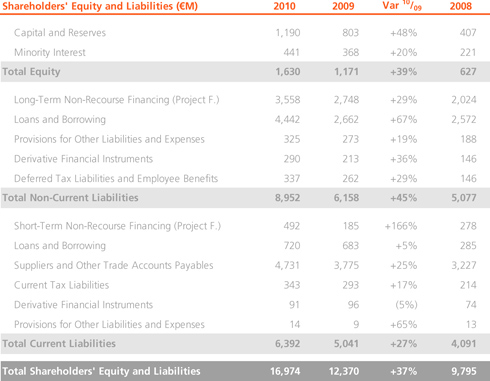
- Shareholders’ equity rose by 39% to €1,630 M, primarily due to the stronger results for the year, the positive impact of the translation differences arising from the appreciation of the Brazilian Real and the Dollar, and the increase in the amount attributable to external shareholders due to the increase in Telvent’s results.
- Non-current liabilities rose by 45% to €8,952 M, mainly from the increase in long term non-recourse financing, which increased from €2,748 M in 2009 to €3,558 M in 2010, and from the three bond issues carried out by Abengoa in 2010 which had an approximate impact on this heading of €1,200 M.
- Current liabilities increased by 27% to €6,392 M, mainly driven by the increase in suppliers and other accounts payable related to various engineering projects.
Composition of Net Debt
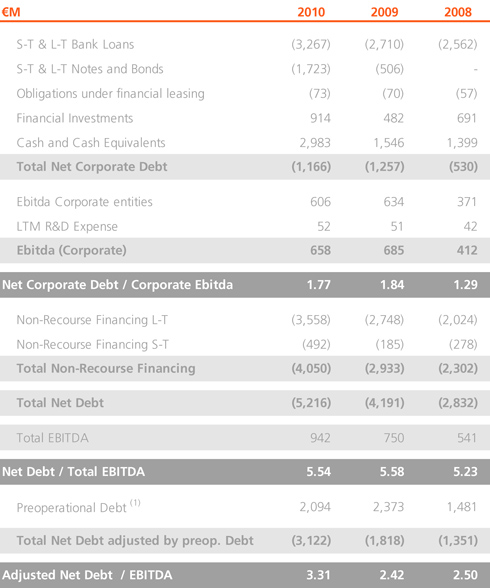
- At a consolidated level, net debt excluding non-recourse financing totalled €1,166 M (net debt position), lower than the €1,257 M in 2009.
- It is important to take into account that of Abengoa’s total net debt (€5,216 M), a total of €2,094 M relates to debt on projects that are under construction and that will therefore generate cash flows in future years. Excluding this pre-operational debt, the net debt figure for Abengoa would be €3,122 M.
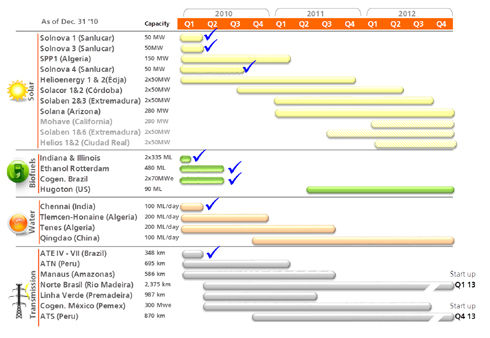
- Abengoa’s principal projects are listed below:
Consolidated Cash Flow Statement
A summary of the Consolidated Cash Flow Statement of Abengoa at the close of 2010 and 2009 with the main variations per item, is given below:
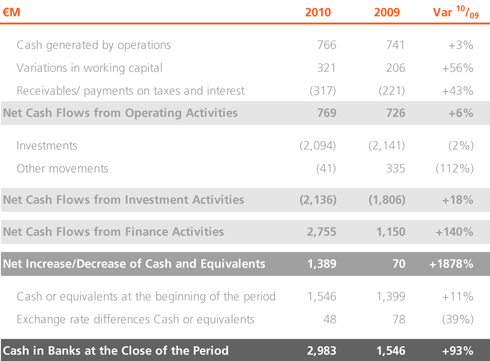
- Net cash flows from operations increased by 6% to €769M compared to €726 M the year before. It is worth highlighting the increase in cash from operations which totaled €766M in 2010 and the management of working capital which generated €249M in cash.
- In terms of net cash flows from investment activities, the most significant investments were in the construction of solar thermal plants in Spain; and in the construction of desalination plants in Algeria, India and China and transmission lines in Brazil and Peru.
- In terms of net cash flows from financing activities, it is worth noting that the Group managed to arrange financing for €3,270 M under difficult financing conditions, taking the figure for net cash flows from financing activities to €2,755 M. It is worth noting the three bond issues carried out by Abengoa in 2010 which allowed the company to raise €1.219 M in long-term financing in the capital markets.
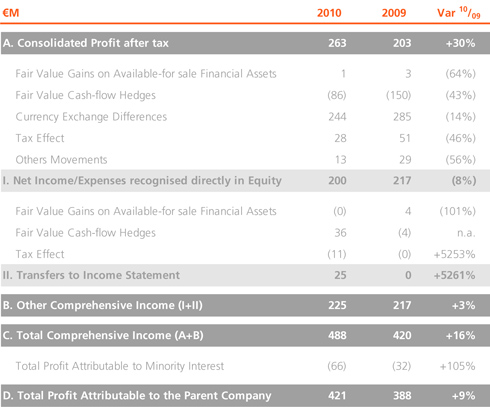
Statement of Comprehensive Income
A summary table on Abengoa’s Global Consolidated Result at the end of 2010 and 2009 is shown below, which includes all the results from those years that directly affected Abengoa’s consolidated equity.
Performance of Business Unit
Evolution of the Solar Business Group
The Solar business group currently has 181 MW of power in operation at the Solúcar Platform that generates thermo-electric solar energy. Broken down by technology, 31 MW is from tower technology while 150 MW is generated by parabolic troughs.
The PS20 tower plant has completed its first full year of operations having come into service in April 2009, while the three Solnova plants that use parabolic trough technology have been operational at the Solúcar Platform since April, June and August, respectively.
The experience accumulated by Abengoa Solar from its parabolic trough pilot plant constructed in 2007, the use of a motorised start-up station and the availability of human and technical teams that are highly specialised in optical alignment, the manufacture of collectors, and processes has been fundamental to the successful start-up of these plants during the year. All of them have been constructed by Abener and Teyma under turn-key supply contracts.
Together with E.ON, more than 70% of the construction of two plants at the Écija Platform has been completed, where more than 200 people are employed and whose work is progressing in line with the project’s planning.
The plants, which have a 50 MW capacity each and use parabolic trough technology, are due to come online at the end of 2011 and early 2012, respectively. When they come into operation, they will generate enough solar energy to supply 52,000 households, preventing the emission of some 62,000 t of CO2.
Abengoa Solar has teamed up with JGC Corporation to construct two new 50 MW solar-thermal plants in El Carpio (Córdoba). Abengoa’s holds a 74% stake in each project and the company is responsible for their operation and maintenance. This agreement is the first time that a Japanese company has invested in commercial solar-thermal plants.
These two projects, which are currently under construction, represent a combined investment of more than €500 M, of which approximately €350 M has been financed through a project finance structure. The financing with JGC was completed in August with four international banks (SMBC, HSBC, Mizuho and BNP Paribas). The two plants, which are due to come into commercial operation in early 2012, will sell their output to the network under existing regulations.
Abengoa Solar has also joined ITOCHU Corporation to construct two 50 MW solar-thermal plants in Logrosán (Cáceres). Abengoa Solar will operate both plants and will maintain control of the projects with a 70% stake, while ITOCHU will own the remaining 30%.
These two projects, which are currently under construction, represent a combined investment of more than €500 M, of which approximately €340 M has been financed through a project finance structure. The financing was completed together with ITOCHU on 16 December with four international banks (SMBC, HSBC, Mizuho and BTMU) and also has a loan guarantee granted by Nippon Export and Investment Insurance (NEXI), a Japanese export credit agency.
Finally, it is worth noting that Abengoa Solar has plants in Spain with a combined capacity of 681 MW included in the Register of Advanced Allocation, which will come into operation in various phases between now and 2014. All of them will use the pricing scheme established in Royal Decrees 661/2007 and 6/2009.
With regards to the company’s international activities, $1,450 M in financing was finalised on December 21 to construct Solana, the largest solar-thermal power plant in the world. The loan will finance the construction and start-up of a 280 MW solar-thermal plant (250 MW net) in Arizona.
The project, which is already under construction, fulfils the requirements of the 1603 Program of the US Department of the Treasury, which means that the project is eligible for a subsidy equivalent to 30% of the total investment cost.
Solana is the first solar plant in the United States with the ability to store the energy that it produces. The Solana project will include six hours of thermal energy storage using molten salts, which will enable it to continue producing electricity when it is cloudy and after the sun goes down. Thanks to this capacity, Solana will be able to produce energy at night time, serving the peak electricity demand in this area during the summer months.
A contract has also been signed with Pacific Gas & Electric (PG&E) to supply the electricity generated at the new Mojave Solar plant. This plant, with a 280 MW capacity (gross), will be located some 150 kilometres northeast of Los Ángeles.
Construction on the largest solar plant in the Middle East also continues, in collaboration with Total and Masdar, Abu Dhabi’s future energies company. The plant, called Shams-1, will cover 300 hectares of the Abu Dhabi desert. Construction on the plant began in 2010 and it will be operational in 2012. The plant will generate enough energy to supply 62,000 households.
Some 60% of Shams-1 (which means “sun” in Arabic) will be owned by Masdar, while the remaining 40% will be owned by a company that is jointly owned by Abengoa Solar and Total.
Abener and Teyma, two Abengoa companies, are responsible for constructing Shams-1 under a turn-key contract. Once constructed, Abengoa and Total will be responsible for operating and maintaining the plant. The electricity generated will be sold to the Abu Dhabi Water and Electricity Company (ADWEC) under a long term supply agreement.
In Algeria, construction continues on the combined cycle plant that is integrated with a solar park. The latter comprises parabolic trough collectors that will produce 150 MW of power, of which 20 MW will come from a field of parabolic trough collectors using thermal oil.
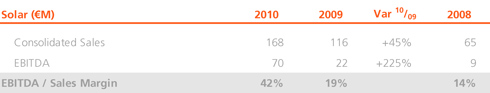
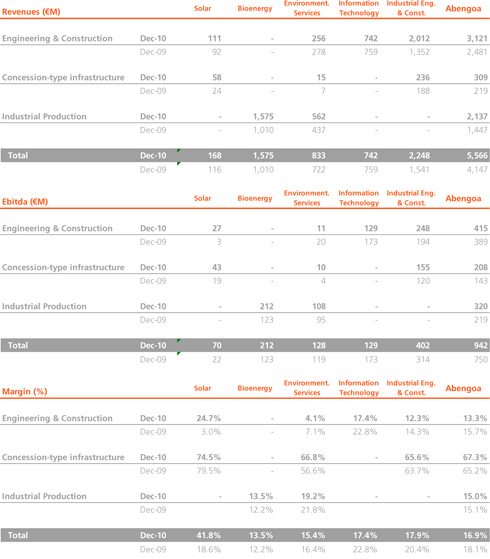
In 2010, sales by the solar business group related to the following:
- A total of €58 M from the sale of solar energy, from 193 MW of capacity in operation using both solar-thermal and photovoltaic technology. It is important to note that 150 MW of this capacity has only been operational for part of the year.
- A total of €111 M from the sale of technology components, knowledge transfers to third parties and solar developments. This section includes components for solar plants as well as industrial systems for generating heat using diverse applications such as air conditioning, water or industrial processes. It also includes solar developments in progress.
Abengoa Solar has a total portfolio of 3,448 MW, including:
Evolution of the Bioenergy Business Group
In 2010, Bioenergy recorded the following results.
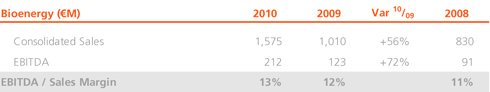
Sales by Abengoa Bioenergy increased by 56% to €1,575 M compared to €1,010 M in 2009. The increase in sales was primarily due to higher ethanol sales in the USA and Europe, and better sales prices across the company’s three regions (Europe, United States and Brazil).
In terms of volumes, the increase in Europe was driven by 100% consolidation of the plant in Salamanca for the whole year (only 50% of its capacity was consolidated last year for nine months) and by the entry into operation of the Rotterdam plant.
In the United States, the increase in capacity was mainly due to the entry into production of the plants in Indiana and Illinois, while weather conditions in Brazil affected the harvest.
EBITDA rose by 72% to €212 M compared to €123 M in 2009, which was largely attributable to the increase in production capacity.
Evolution in Europe:
- The volume of ethanol sold totalled 973 ML (36% more than 2009), primarily due to the 100% integration of the Salamanca plant (Spain) compared to 50% following its acquisition in the fourth quarter of 2009, in addition to the entry into production of the Rotterdam plant in the third quarter of 2010.
- The price of ethanol rose to €0.566/L (compared to €0.538/L in 2009).
- Nevertheless, these affects were offset by the rise in the average price of cereals in 2010 to €172.6/t (€151.3/t in 2009).
- It is also worth noting the effect of the increase in natural gas prices, from €22.2/MWh in 2009 to €23.5/MWh in 2010.
Evolution in the United States:
- Ethanol sales jumped by 96% to 329.8 M gallons compared to 2009, largely attributable to the coming into production of the plants in Indiana and Illinois, which were still under construction in 2009.
- Ethanol prices were also higher than in 2009, rising from US$ 1.74/gal in 2009 to US$ 1.83/gal in 2010.
- Cereal prices also rose from US$ 3.8/bsh in 2009 to US$ 4.0/bsh in 2010.
- The price of natural gas also increased from US$ 4.7/mmbtu in 2009 to US$ 5.3/mmbtu in 2010.
Evolución en Brasil:
The main volumes and prices of products sold in Brazil were:
- In 2010 the volume of ethanol rose to 165.4 ML from 160.2 ML in 2009.
- Ethanol prices were higher during the year at BRL 0.966/L compared to BRL 0.811/L the previous year.
- The volume of sugar in 2010 fell to 354,500 t versus 418,300 t in 2009.
- The price of sugar for 2010 rose to BRL 761.4/t compared to BRL 703.5/t the previous year.
- The milling capacity increased to 6,900,000 t by the end of 2010.
Evolution of the Environmental Services Business Group
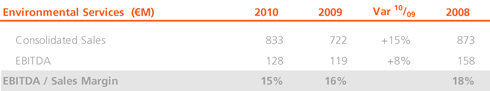
In 2010, Befesa’s sales rose by 15% to €111 M, compared to 2009, driven by a substantial increase in the volume of treated waste across all areas of the Group.
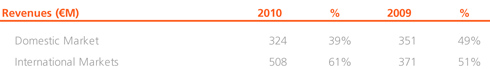
The international markets recorded significant growth compared to the domestic market, accounting for 61% of total sales compared to 51% in 2009.
Befesa’s EBITDA rose by 8%. To understand the evolution of the business in 2010 on a like-for-like basis with 2009, the effect of the acquisition of the salt slag recycling and treatment plants in Germany should be excluded from the income statement for 2009, equivalent to €28 M. Once excluded, EBITDA recorded an increase of €38 M compared to 2009 on a like-for-like basis (a rise of 42% compared to 2009). The EBITDA/Sales ratio would also have improved by 2.8 points to 15.4%.
The results of Befesa’s two business segments (industrial waste recycling and water) are analysed below.
Industrial Waste Recycling
In 2010 there was a clear recovery in the key sectors in which Befesa operates, which was reflected in the results of the recycling businesses.
Against this backdrop, a total of 2,221,000 t of industrial waste were treated in 2010, an increase of 21.5% compared to the same period the previous year.
In 2010 sales in the industrial waste recycling segment rose by 35.8% to €151.4 M, compared to the year before.
Like-for-like EBITDA jumped by 61.5% to €40.8 M compared to 2009, and the EBITDA/Sales ratio also improved by 19% to 18.6%.
Water and Concessions
The strong levels of execution and new contracts in the water construction and engineering activity continued throughout 2010. This led to similar levels of sales to 2009 while the order book for 2011 and 2012 has continued to grow. EBITDA margin also remained at similar levels to 2009.
Sales in the water segment in 2010 fell by 5.0% compared to the previous year, while EBITDA also decreased compare to 2009 with an EBITDA/Sales ratio of 8%.
Evolution of the Information Technology Business Group
During 2010, Telvent once again managed to record positive growth, which was a major achievement for the company given that the year was full of challenges caused by financial instability in the international markets, tighter budgets for both public and private clients in the world’s leading economies, and concerns about the Eurozone, among other issues.
Telvent continued to develop its commitment to sustainability and security, especially in the search for management excellence and innovation, applicable to every operating environment and professional relationship, from its shareholders, potential investors, analysts, clients and suppliers, through to the professionals that comprise the company and society in general. All of this within the strategic framework defined by its mission, vision and values.
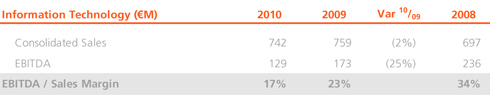
In 2010 revenues from information technologies recorded organic growth of 3.1% compared to the previous year. Sales totalled €742 M compared to €719 M in 2009, excluding the €40 M in sales from the internal “outsourcing” activity that the company sold on January 1, 2010. This growth in sales was primarily due to the strong performance of the energy activity, both for electricity and oil and gas, combined with good results in the environment, agriculture and global services segments. It is worth noting that every segment recorded organic growth, except transport, which was affected by budget pressures in the majority of public sector clients as a result of the global economic slowdown in general. In addition to higher sales, operating margins also improved, making Telvent a more profitable and efficient company, while the company’s strategic vision has also been strengthened in those markets that have a direct impact on the sustainability of the planet.
In 2009 EBITDA was affected by the capital gain from the sale of a minority stake in Telvent for €56.3 M. If this capital gain is excluded, EBITDA growth would be 11%, while the EBITDA/Sales ratio would have increased by 2.1 points.
The figures for new contracts and the order book were also healthy at the end of 2010, which gives us confidence looking forward to 2011 and to continue growing in the future. New contracts during the year totalled €787 M, with a book-to-bill ratio greater than one, indicative of a healthy outlook with regards future sales. The order book (contracts pending execution) ended the year with orders worth approximately €930 M, providing a solid base for future growth.
Business Areas and Geographies
In 2010, Telvent continued to offer information services and high value-added technological solutions in those sectors that are critical to the sustainability of the planet: energy, transport, environment and agriculture. It also managed to expand its presence in key regions, laying the foundations for new business opportunities and greater diversification.
Energy represented approximately 35% of the global business in 2010, growing by 10.4% compared to the previous year. Telvent has continued to invest in developing solutions and services that contribute to excellence in the performance of its clients. The activities of the oil and gas division have exceeded our forecasts, with significant growth in market share and in raising brand awareness in Smart Grid projects in the electrical sector. During this period, the energy business has consolidated its position as the most important segment in terms of sales, while also being an engine for growth. The leadership position in the oil and gas sector has been maintained, while also developing the electrical sector thanks to the efficiency achieved with the strategy to provide higher added-value intelligent network solutions (Smart Grid).
Transport was the second most important segment in terms of sales in 2010, accounting for approximately 27% of the activity during the year, despite the slowdown in this segment compared to the previous year. This area has been hit by budgetary pressures in most public sector clients as a result of the global economic slowdown in general. Despite the financial outlook, Telvent recorded positive results in Latin America, while maintaining its leadership position in Spain and the USA. Thanks to a strategy that combines constant evolution and globalisation, the transport segment has increased the number of projects being executed as well as winning new contracts, mainly in the field of urban mobility, passenger information services and toll management.
Environment, which accounts for 8% of total business, ended the year with growth of more than 5% compared to 2009. The consolidation of the water business in North America and the integration of DTN Weather, Telvent’s information services and weather forecasting unit, allowed the environment division to successfully overcome the challenges of 2010.
Agriculture, a key segment in the company’s strategy to provide solutions that help to develop a more sustainable world, now accounts for 11% of the business. The volatility that characterises the agricultural sector has once helped this business to grow. Fluctuations in seed and fertilizer prices have reinforced the value of Telvent as a market leader in the supply of critical business information that supports the production, sale and distribution of cereals and livestock, especially in the influential North American market. The company’s subscription services have maintained their traditionally high levels of client retention (higher than 90%) and the client portfolio has also grown with new agricultural producers and businesses.
Global Services also recorded another year of organic growth. During 2010, when this segment represented 19% of the total business, the foundations have been laid for growth in future years. The culmination of the process to integrate three legal entities in Spain into a single company has been accompanied by the consolidation of the division’s own capabilities in the areas of consultancy and data centres, as well as relations with software and hardware manufacturers. During 2010, not only has it been possible to combine the strategic vision of consultancy with the precision and reliability of engineering, enriching Telvent’s overall service layer, but the company has also managed to expand its presence in Latin America and the USA and 2010 has been an important year in terms of the internationalisation of the global services business.
Finally, in 2010 Telvent continued to diversify its geographical presence, expanding its activities into new regions while maintaining its position in its core geographies, such as Europe and North America. Latin America and North America are the regions that recorded the highest growth in activity levels both in absolute and relative terms.
Evolution of the Industrial Engineering and Construction Business Group
During 2010, the Industrial Construction and Engineering Group continued the growth of previous years, with sales up by 46% to €2,248 M compared to 2009.
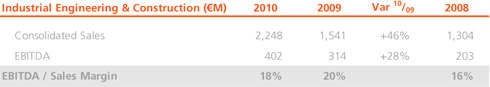
It should be noted that in 2010 this business group included the aforementioned capital gain from the sale of two transmission lines in Brazil totalling €68.9 M. Excluding this capital gain, the increase in EBITDA would be 6%.
Important contributions to the positive performance of this business group came from the construction of solar-thermal plants; the increase in the international activity of Inabensa; and the concessions for high voltage lines in Latin America, especially the construction of the Madeira continuous current line that will be 2,475 km long, and the construction of the Pemex cogeneration plant in Mexico.
This business growth and international development has positioned Abeinsa as one of the global leaders in its sectors. Furthermore, according to the latest data published by Engineering News-Record magazine, Abeinsa is the leading contractor in the world in terms of international contracts related to the construction of electricity distribution and transmission infrastructures, and is ranked third for the construction of energy infrastructures.
The evolution by business area is as follows:
- In the Energy segment Abener Energía and Teyma have both consolidated their position in the solar market with the start-up of three 50 MW solar-thermal plants in Spain, and have started projects for four more plants.
- In the international market, construction on the world’s first two Integrated Solar Combined Cycle (ISCC) plants has been completed, located in Morocco (482 MW) and Algeria (150 MW), both global pioneers of this technology.
- Also in the solar segment, construction has begun on two larger scale solar-thermal plants, Shams-1 (110 MW) and Solana (280 MW), in the United Arab Emirates and the USA, respectively.
- In the conventional electricity generation market, Abener is constructing a new 300 MW cogeneration project in the state of Tabasco (Mexico) in collaboration with Abengoa México.
- In the Installations segment, the figures from 2009 have been consolidated thanks to the correct execution of our projects in 2010, including:
- The execution of Lot 2 of the Siepac project (the electrical interconnection system for Central American countries), which consists of a 230 kV electricity transmission line and the simple circuit 400 kV Misurata-Surt-Ras Lanouf-Agdabia line that is 575 km long.
- Inabensa’s concessions activity has developed well, participating in the construction of singular buildings and the subsequent management of the concession company. In this business line, construction had continued on the new hospital and external consultation facilities of the Hospital Costa del Sol in Marbella (Malaga) and on the Mexico City Cultural Centre in Texcoco (Mexico State).
- In Ancillary Manufacturing and Sales it is worth noting that the 100% growth in sales from 2009 was maintained, both by sales agents and Eucomsa. Manufacturing for the solar energy plants that use parabolic trough collectors is particularly important for the latter.
- In Telecommunications, Abeinsa continued to develop its traditional telecommunications network integration and turnkey projects activity during the year.
- Latin America recorded significant business growth, with a 100% increase compared to 2009, making Abeinsa the fourth largest construction contractor in Latin America according to Engineering News-Record magazine, despite the fact that its business is mainly focused on the energy sector.
- Other projects included the construction of 5,000 km of high voltage lines in Brazil. In the transmission lines concession activity, Abeinsa recorded EBITDA of approximately €150 M in 2010.
- In Peru, Abeinsa is finishing construction of the 670 km Carhuamayo-Carhuaquero transmission line and has begun construction on the 500 kV Chilca-Montalvo transmission line that will be 872 km long.
- During 2010 Teyma Uruguay implemented some important developments, incorporating Teyma USA and acquiring Abacus in the USA, which together with its other subsidiaries, will allow it to carry out works in the USA, Europe, North Africa and the Middle East, as well as consolidating itself as the leading construction firm in Uruguay.
- In the Environment segment, Abeinsa New Horizons continued to its commitment to sustainability, significantly increasing its investment in R&D+i in fuel and hydrogen cells through its subsidiary Hynergreen Technologies, as well as in new renewable and energy efficient energies through the R&D division of Instalaciones Inabensa.
- The activities of carbon trading and Clean Development Mechanism (CDM) projects related to the Kyoto Protocol are grouped together in ZeroEmissions Technologies. ZeroEmissions continues to carry out CDM projects with companies from various countries such as China and India.
Given this higher volume of business, Abeinsa’s revenues have improved satisfactorily during this year.
Human Resources
During 2010, Abengoa’s average workforce increased by 9% to 26,500 people compared to the previous year (24,225).
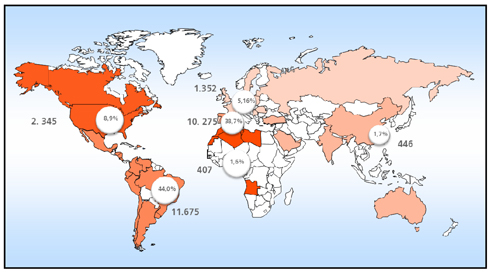
Geographical distribution of the workforce
The distribution of the average number of employees was 39% in Spain and 61% abroad.
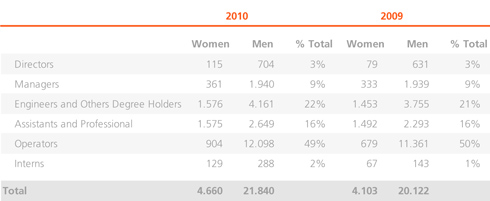
Distribution by professional groups:
The distribution by category of the number of employees during 2010 and 2009 was as follows:
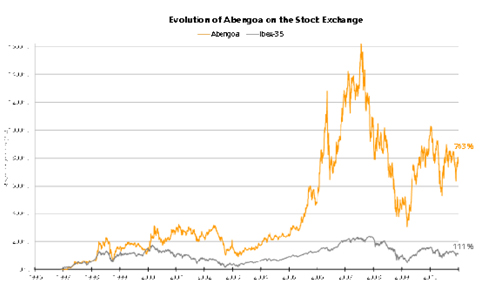
Stock Exchange Evolution
According to the figures supplied to the company by Bolsas y Mercados Españoles, 146,655,189 shares were traded in 2010 equivalent to an average daily volume of 572,872 shares and an average traded cash value of €10.7 M per day.
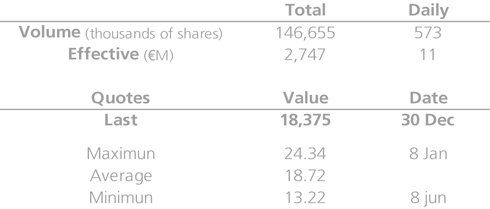
The final listed price of Abengoa’s shares in 2010 was €18.375, which is an 18.69 % decrease on the closing price for the previous year (€22.60). Minimum, maximum and average listed share prices in 2010 were €13.22 (June 8th), €24.34 (January 8th) and €18.72, respectively.
As a historical reference, since Abengoa’s Initial Public Offering on November 29, 1996, the company’s shares have revalorized 763.2 % which is more than 8.6 times the initial price. During this same period, the select IBEX-35 has revalorized 111.2 %.
Risk Management and Internal Control
Our environment is defined by an astonishing acceleration in technology, the speed of social, economic and political change and the need to create value.
To tackle the threats from this scenario, as well as to make the most of the opportunities that arise, Abengoa believes that risk management is an essential activity and function for making strategic decisions and that it is essential to have criteria and methodologies to ensure that the business grows safely.
Our risk management model comprises two key elements:
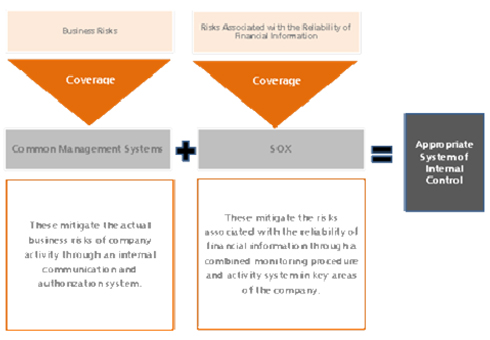
Both elements make up an integrated system that allows risks and controls to be appropriately managed at every level of the organisation.
This is a dynamic system that is continuously modified in order to stay up to date with the reality of the business.
Business Risks
Our “Common Management Systems” represent a common culture for Abengoa’s distinct businesses. They identify the risks, establish the coverage and determine the control activities. They are comprised of eleven rules that define how each potential risk included in Abengoa’s universal risk model must be managed.
The Common Management Systems, which implement the necessary business and risk management in Abengoa, apply to every business group and activity area and involve the different levels of management. They include specific procedures that cover any action that may generate a risk to the organisation, both financial and non-financial.
Abengoa’s risk management process, with regards to the Common Management Systems, is a continuous cycle based on five key stages, as shown in the figure below:
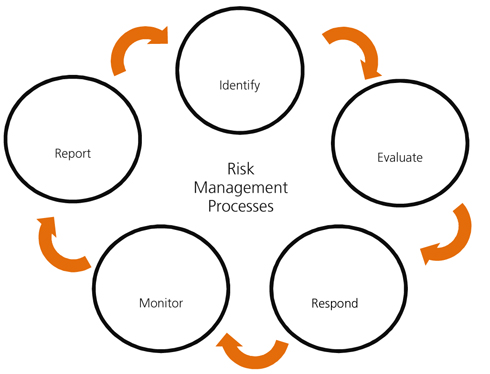
Coherent and regular communication to achieve good results is essential in each phase. Since this is a continuous cycle, permanent feedback is required in order to continuously improve the risk management system.
Furthermore, and as a way of emphasising the involvement of all managers in managing risk, each of the rules in the Common Management Systems must be verified and certified with regards to compliance of these procedures. This annual certification is issued and submitted to the Audit Committee in January of the following year.
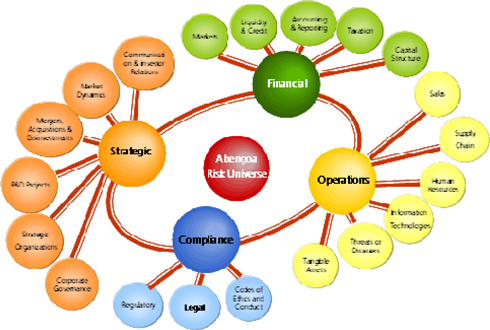
In addition, in 2010 work has continued on developing a methodology that complements the Common Management Systems in order to quantify the impact and probability of the risks that comprise these systems. This methodology (Abengoa’s Universal Risk Model) classifies the risks into four categories, 20 sub-categories and a total of 94 main risks for the business. Each of these risks is associated with a series of indicators that measure the probability and impact of each risk, and define the degree of tolerance towards them.
Risks relating to the reliability of financial information
In 2004 Abengoa began a process to adapt its internal control structure for financial information to the requirements of Section 404 of the Sarbanes-Oxley Act (SOX). This process continues to be implemented in new companies that are acquired.
The SOX Act was passed in the USA in 2002 in order to guarantee transparency in the management, accuracy and reliability of the financial information published by companies listed in the US market (“SEC registrants”). This law requires these companies to subject their internal control system to a formal audit by their annual accounts auditor, which must also issue an independent opinion on the system.
According to the instructions of the Securities and Exchange Commission (SEC), compliance with this law is obligatory for companies and groups listed in the North American market. Although only one of Abengoa’s business groups (Information Technology, Telvent) is required to comply with the SOX, Abengoa believes that these requirements should apply to all of its companies, in addition to its NASDAQ listed subsidiary, and these requirements are supplementary to the risk control model used by the company.
At Abengoa we see this legal requirement as an opportunity for improvement and far from being satisfied with the conditions included in this law, we have tried to further develop our internal control structures, control procedures and the evaluation procedures applied, as much as possible.
This initiative is a response to the rapid expansion of the Group over the last few years and its forecasts for future growth, in order to be able to continue to guarantee investors precise, timely and comprehensive financial reporting.
In order to comply with the requirements of Section 404 of the SOX, Abengoa has redefined its internal control structure following a top-down approach that involves the initial identification of the important risk areas and the evaluation of the controls that the company has for them, beginning with those carried out at the highest level (corporate and supervision controls) and proceeding to evaluate the operational controls in each process.
Some 53 different processes have been identified that could have a potential impact on the company’s financial information. There are more than 550 essential control activities in total, which are subjected to continuous supervision by the Group’s internal audit teams.
Furthermore, our internal control system is subjected to evaluation by our external auditors, who issue an opinion on it based on PCAOB (Public Company Accounting Oversight Board) auditing standards applicable to listed companies in the United States (SEC registrants).