Annual Report 2009
- Legal and Financial Report
- 2009 Annual Consolidated Accounts
- Notes to the Consolidated Annual Accounts
- Note 38.- Financial Information by Segment
Note 38.- Financial Information by Segment
38.1. Information by business segment
The information by Business Segment is analysed between the five Business Groups which Abengoa operates (see Note 1.2). These segments are.
- Solar.
- Bioenergy.
- Environmental Services.
- Industrial Engineering and Construction.
- Information Technology.
a) The following table includes a detail of the Income Statement by Business Segment for the periods ending 31 December 2009 and 2008:
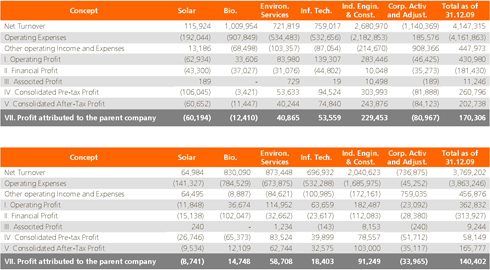
Benefits obtained through the reduction of stock shares in Telvent GIT, S.A. fall within the business segment of Information Technologies (see Note 2.2).
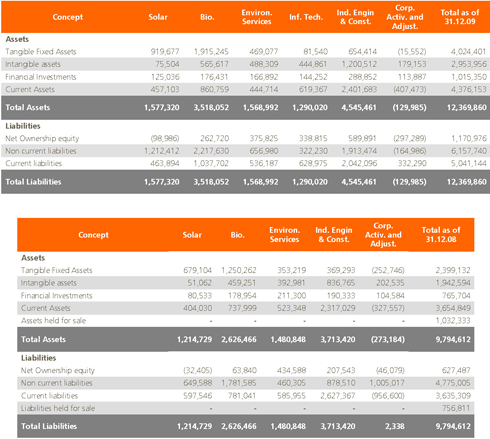
b) The following table shows a detail of assets and liabilities of the group by business segment as at 31 December 2009 and 2008:
The underlying basis of preparation of the Income Statement by Business Segment is as follows:
1. The data is grouped together for each of the business segments on the same basis as used for the sub-consolidation under each segments’ holding company.
2. The Corporate Activity and Adjustments column includes those income statement items and assets and liabilities arising in the normal course of business, but which are not allocated to other segments. These are predominantly items which are reported on the parent company balance sheet or are adjustments arising upon consolidation, which primarily relate to the elimination of intercompany transactions.
3. The Group additionally has auxiliary activities which do not fall within the main business segments, such as portfolio held companies and companies undertaking agricultural activities, although these activities account for less than 5% and are insufficient so as to warrant a further business segment. As such, these activities are grouped together within the most appropriate Business Segment column (Bioenergy and Corporate Activity).
c) The following table provides a detail of Net Debt by Business Segment as of 31 December 2009 and 2008:
The underlying basis of preparation of Net Debt by Business Segment is as follows:
1. The data is grouped together for each of the business segments on the same basis as used for the sub-consolidation under each segments’ holding company.
2. The Corporate Activity and Adjustments column includes those items and assets and liabilities arising in the normal course of business, but which are not allocated to other segments. These are predominantly items which are reported on the Parent Company Statement of Financial Report or adjustments arising upon consolidation, which primarily relate to the elimination of intercompany transactions.
3. The Syndicated Debt as provided to Abengoa S.A. for the amount of € 2,059 M has been distributed among the business segments reflecting that the main purpose of the loan is to finance the investments and projects of companies which are expanding their operations.
4. In calculating Net Debt, financial investments should and have been included as a reduction to net debt on the basis that they are highly liquid in nature.
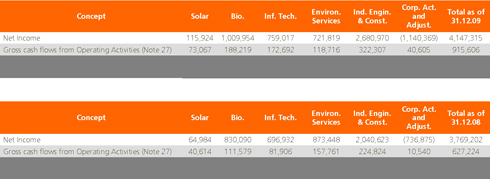
d) The following table presents the Group’s net revenues and operating cash flows by business segmentfor for the years ending 31 December 2009 and 2008:
The underlying basis of preparation of Revenues and Operating Cash Flow by Business Segment is as follows:
1. The data is grouped together for each of the business segments on the same basis as used for the sub-consolidation under each segments’ holding company. .
2. The Corporate Activity and Adjustments column includes both net revenues and cash flows which are not allocated to the main business segments, such as those adjustments arising upon consolidation.
3. The column “Corporate Activity and Adjustments” includes those adjustments arising upon consolidation which relate to operations undertaken between the business segments relating to Solar and Bioenergy fixed assets.
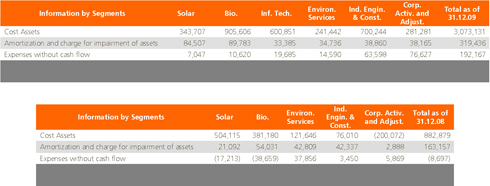
e) The following table shows a detail by Business Segment of the amounts related to the cost of acquisition or production of assets, amortisation and depreciation as well as costs which have not given rise to a cash outflow:
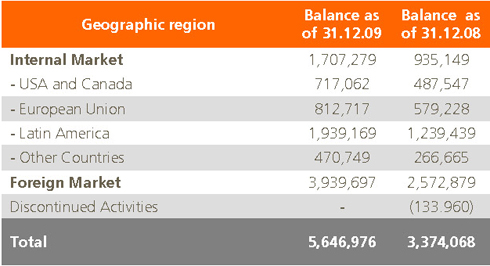
38.2. Information by geographical region
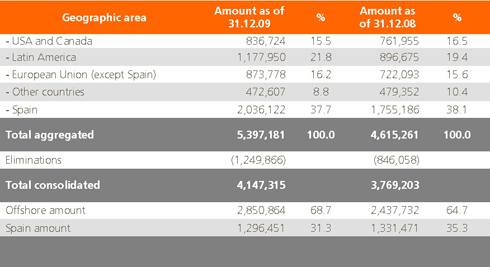
a) The following table shows analysis of revenues by geographical region for the year ending 31 December 2009 and 2008:
b) The following table shows analysis of the net book value of fixed assets (Intangible and Tangible) by geographical region (Intangible and material) as at 31 December 2009 and 2008: