Annual Report 2010
- Corporate Social Responsibility Report
- Committed to Innovation
- Advanced R&D Management
At Abengoa, most R&D+i investment involves applied research and development of technological innovation in the company’s approach to fulfilling the strategic objectives of sustainability and new product creation.
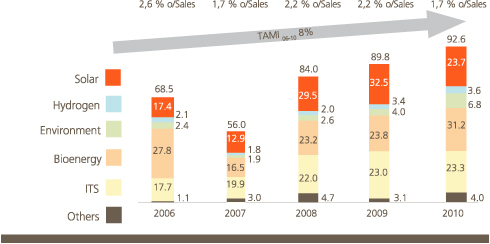
Abengoa’s R&D investment totaled €92.6 M in 2010, up 3.2 % year-on-year and representing approximately 1.7 % of the company’s revenue and an upward trend of 8 % in annual growth of this investment (CAGR06-10 8 %).
The following table reflects changes in R&D investment by business area over recent years at Abengoa.
R&D investment data for 2010
In recent years, Abengoa has been driving forward initiatives aimed at constructing a framework in which research, development and innovation move forward in a coordinated fashion. Thus, the Stage-Gate methodology-based tool put in practice in 2009 was further consolidated in 2010. This tool ensures that R&D projects are managed within a common framework of excellence, and are also aligned with Abengoa’s strategic objectives. This methodology outlines the chief steps to be taken when preparing and developing an R&D-categorized project within the project portfolio of the Abengoa business units. The aim is to obtain the most standardized focus possible for R&D projects through the utilization of a common methodology to define processes, while maximizing the value that the R&D projects add to Abengoa businesses and minimizing the risks involved.

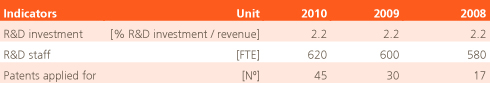
Another initiative undertaken in 2010 was the development of a system of innovation indicators aimed at decision-making and monitoring of R&D activities. Setting up these indicators adheres to the basic principle of “what cannot be measured cannot be improved ”, with the aim being to evaluate both tangible and intangible aspects of innovation. Its purpose is to create a quantified framework of reference for R&D+i measurement and analysis at Abengoa. It is also intended for dissemination and use as a tool to improve innovation management and decision-making processes.
Three indicators were quantified in 2010:
- The R&D personnel indicator, which encompasses all personnel directly employed in this area, as well as people who provide services directly related to R&D activities, including: Directors, administrative staff and office personnel. The basic unit utilized for this indicator is “full-time equivalent staff over the course of one year” (FTE) according to the Spanish National Statistics Institute (Instituto Nacional de Estadística).
- Number of patents applied for each year.
- R&D investment, which is defined as all annual gross R&D expenditure, including internal current and capital expenditure according to the Frascati manual regarding the group’s total revenue.
The table below shows the evolution of the R&D indicators in recent years at Abengoa.
Beginning in 2011, a new indicator, referred to as innovation effort, will be added in order to measure R&D assessment in relation to R&D investment effort.
Abengoa’s R&D investment totaled €92.6 M in 2010, up
3.2 % year-on-year and representing approximately 1.7 % of the company’s revenue and an upward trend of 7.8 % in annual growth of this investment